Data Storytelling with Flourish Studio

flourish_home

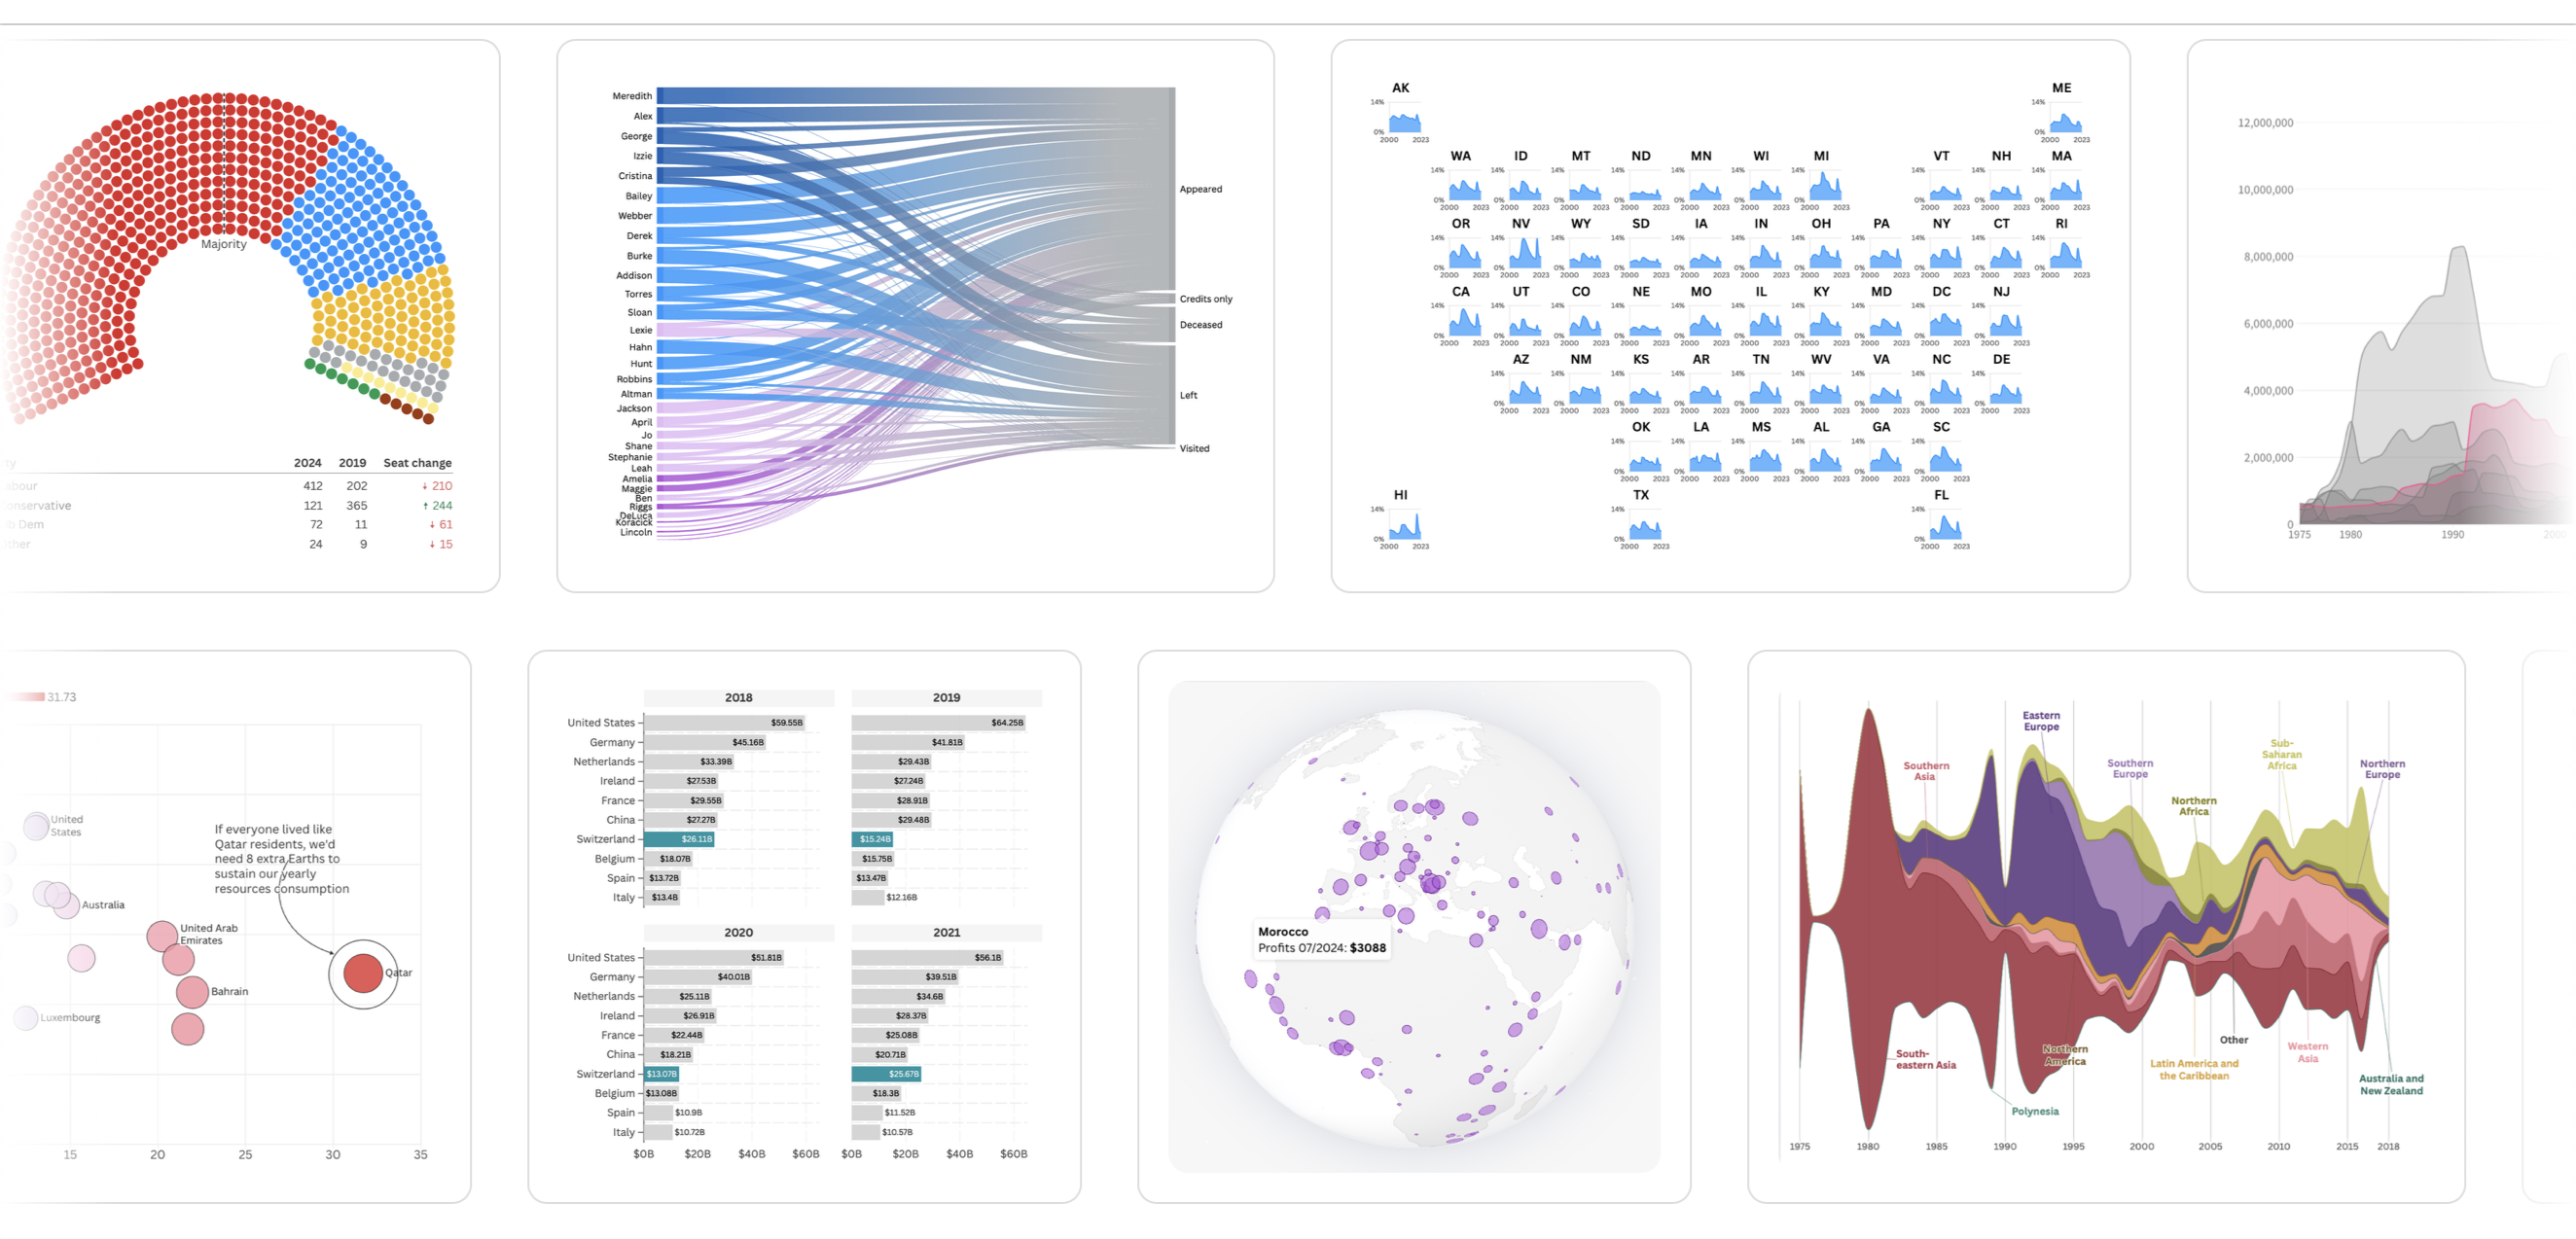
Data storytelling is no longer just a buzzword—it’s a tool that turns raw numbers into narratives. Whether you’re presenting business performance, analyzing social trends, or sharing a compelling research finding, the way you visualize your data can make or break your story. That’s where Flourish Studio comes in. I recently gave Flourish Studio a try, … Read more

Precision and Accuracy in Analytics

Precision and accuracy in digital analytics

Starting with digital analytics means understanding two important factors – Precision and Accuracy. Picture them as essential elements, much like the key components in your machinery. These terms play distinct roles in shaping your digital analytics reporting and insights. What’s Precision? Imagine precision as the well-calibrated rhythm of your machinery – hitting the bullseye with … Read more

Correlation – Causality in Digital Analytics

Correlation and Causation in Digital Analytics

Consider a scenario where you observe a correlation between increased ice cream sales and more people at the beach. The correlation signifies that these two events tend to occur simultaneously. Now, assuming a causal relationship implies that selling more ice cream directly leads to an influx of beachgoers. However, upon closer inspection, you may discover … Read more

Get Started with Apache Superset for Data Visualization

Apache_Superset_Screenshot

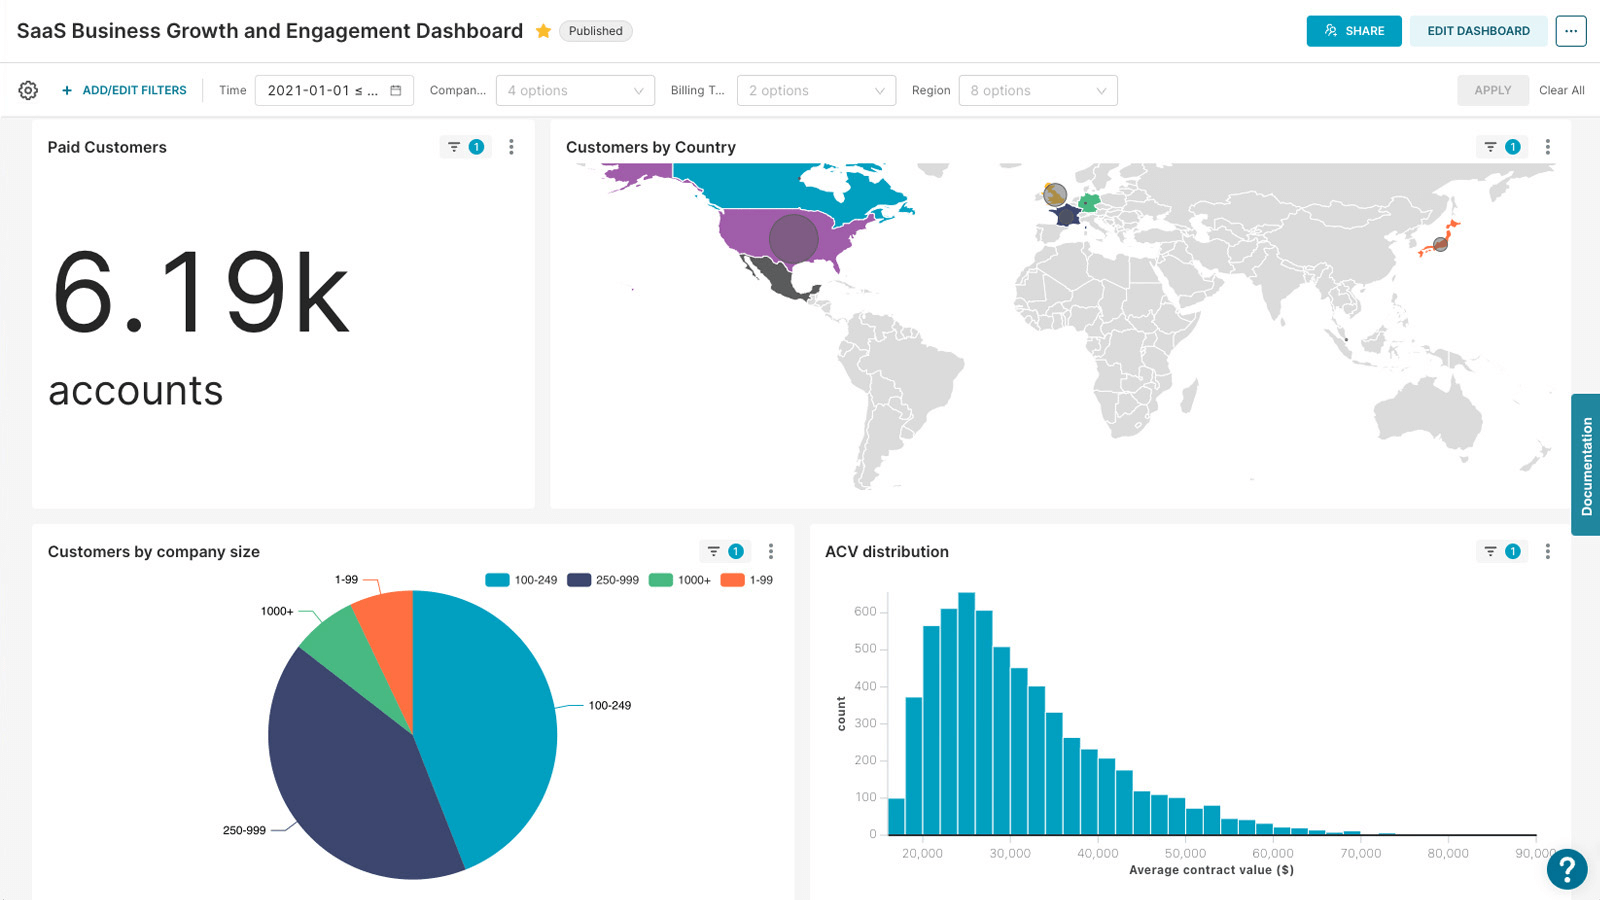
If you’re an analyst or part of an analytics team, you’ve probably faced your share of challenges with traditional BI tools. They’re often expensive, clunky, and not user-friendly. Enter Apache Superset, an open-source BI tool that’s gaining traction for its simplicity, customization, and cost-effectiveness. Apache Superset started at Airbnb to address their need for a … Read more

Tips to Enhance Digital Analytics Reports

Enhance Digital Analytics Reports

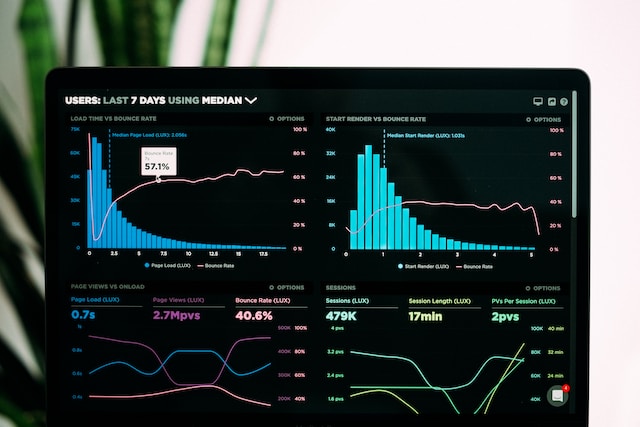
Today businesses are swimming in a vast ocean of digital data, encompassing websites, social media platforms, e-commerce channels, email campaigns, and paid media. Amidst this flood of information, digital analytics reports serve as invaluable compasses, guiding organizations towards the shores of actionable insights. However, not all reports are created equal, and many fall short of … Read more

Improve ChatGPT responses with prompt guide

CHAT-GPT-PROMPT-ENGNEERING

Picture this: you’re a social media manager responsible for creating engaging posts for your company’s accounts. You’ve heard about the power of AI-generated content and decided to give ChatGPT a try. You’re excited about the possibilities of having a writing assistant at your fingertips, but as you start using ChatGPT, you realize that the output … Read more

Comparing Data App Frameworks

DATA-APP-FRAMEWORK

Choosing the right data app framework is crucial when building data apps. With numerous options available, including Streamlit, Dash, Bokeh, Flask, and Django, it’s important to consider several factors to make an informed decision. In this blog post, we will compare these frameworks based on various parameters to help you choose the most suitable one … Read more

Quick Dashboard for Ad Hocs in Python

Quick Dashboards in Python Art

In today’s data-driven world, the ability to quickly extract valuable insights and make informed decisions is crucial. Ad hoc analysis, which involves exploring data on-the-fly for quick insights, plays a vital role in this process. However, relying solely on traditional analysis tools can be limiting. That’s where custom dashboards come in. These personalized and user-friendly … Read more

Automating presentations using python

Presentation Automation Python

Presentations are a crucial component of communicating data-driven insights to stakeholders. Analysts often find themselves in a constant battle, striving to extract and transform data, generate meaningful visualizations, and interpret the findings for their stakeholders. The repetitive nature of these tasks, coupled with unrealistic stakeholder requests, can make the process tedious and time-consuming. However, with … Read more

Charting Course to Data Insights & Discovery

Navigating data charting course

Ahoy there, As digital analysts, we understand the importance of data in driving business success. However, with the vast amount of information available to us, it can be challenging to navigate through it all and uncover valuable insights. It can feel like we’re sailing through rough waters, unsure of the best course to take. But, … Read more