Imagine being on a quest for hidden riches, and you stumble upon a set of mysterious symbols. To succeed, you must decipher these enigmatic clues, much like decoding the intricate data sets in digital analytics reports. It’s a journey filled with uncertainties, and finding the right path to success can be as elusive as locating buried treasure.
Guiding Leaders Away from Low-Value Metrics
Steering leaders and analysts away from low-value metrics is akin to guiding explorers in a dense forest. Imagine you’re leading a group of explorers in search of hidden treasures. To maximize your chances of discovery, you must ensure they focus on finding rare and valuable artifacts rather than getting lost in the underbrush. In digital analytics, this means prioritizing metrics that truly impact your business, such as conversion rates or customer lifetime value, instead of fixating on vanity metrics like page views or social media likes. It’s like guiding your exploration party to uncover priceless gems rather than collecting ordinary rocks.
Creating an Actionable Path to Analytics Excellence
Picture this as building a roadmap for your analytics journey. Imagine you’re planning a cross-country road trip with a group of friends. To ensure a smooth and successful journey, you need a clear and actionable roadmap, complete with milestones and directions. Similarly, in digital analytics, creating a clear path involves defining key objectives, setting measurable goals, and outlining the steps to achieve them. For example, if your goal is to increase online sales, your roadmap might include optimizing product pages, implementing A/B testing, and refining your marketing strategies based on data insights. It’s like having a detailed itinerary that guides you through each step of your adventure, ensuring you reach your desired destination.
Role of Machine Learning & Automation
Think of this as harnessing the power of technology to make your journey smoother. In the world of digital analytics, machine learning and automation are like having a trusty GPS system that continuously analyzes traffic data, suggests optimal routes, and even adjusts your itinerary based on real-time conditions. For instance, imagine a scenario where machine learning algorithms predict customer behavior, automate email marketing personalization, and identify anomalies in website traffic patterns. Just as a GPS system helps you navigate unknown roads and avoid traffic jams, machine learning and automation streamline your analytics processes, making them more efficient and effective.
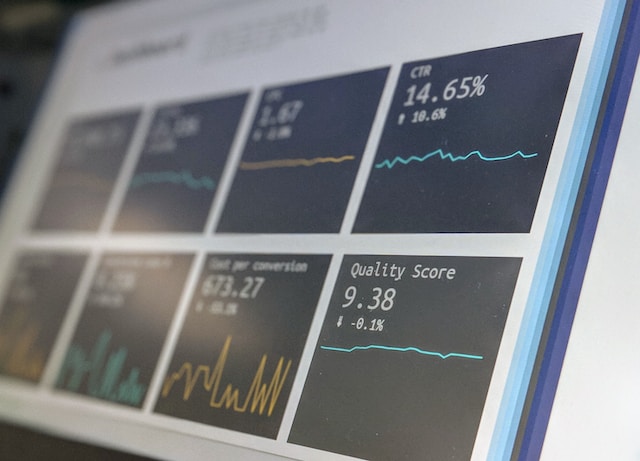
CMO Dashboard vs. Director’s Dashboard
This is like customizing your navigation tools for different terrains. Consider your analytics tools as navigation instruments. Your Chief Marketing Officer (CMO) needs a dashboard tailored to strategic marketing decisions, akin to a captain’s helm with a clear view of the horizon. On the other hand, your Director requires a more detailed dashboard, resembling a navigator’s station with precise charts and data points for tactical decisions. Imagine you’re equipping your ship with specialized instruments for different aspects of your journey. The CMO’s dashboard is like a telescope, providing a broad view of marketing strategies, while the Director’s dashboard is like a navigational chart, offering detailed guidance for specific actions. Each tool is designed to help you navigate different terrains effectively.
Creating the Influence Matrix: A Practical Tool for Digital Analytics Reporting
To address these multifaceted questions and challenges, I embarked on a mission to craft something both powerful and easy to use. The ultimate goal was to develop a framework that could cut through the complexity, offering clarity and practicality. The outcome of this endeavor is what I now call the “influence matrix.”
Understanding the Influence Matrix
This framework is akin to a map that navigates us through the intricate terrain of digital analytics, much like using geographical coordinates to chart a course. Imagine it as a coordinate system with two axes:
- x-axis: Measures how quickly data becomes useful. Consider this axis as the speed at which your ship gathers information during the journey. Some data, like website traffic statistics, is available in real-time and is akin to your ship’s speedometer, instantly showing how fast you’re progressing. Other data, such as long-term customer lifetime value, takes time to accumulate and mature, resembling a valuable cargo that grows in worth over time.
- y-axis: Gauges the impact of metrics. The scale goes up dramatically as you rise along the y-axis. Metrics like revenue generated per customer are like massive waves, capable of swaying your ship (business) significantly. In contrast, metrics like the number of social media likes are more like ripples, making a minor splash.
The beauty of this framework lies in its ability to position all our metrics and key performance indicators (KPIs) on the map, making it clear which metrics are valuable and impactful.
Selecting the Right Metrics
In the context of the Influence Matrix, metrics serve as our guiding compasses during the journey. Selecting the right metrics is crucial to ensure we stay on course and reach our destination successfully.
- For instance, consider a scenario where a business aims to increase its online sales. In this case, metrics like revenue generated per customer and conversion rates are like compasses pointing the way. Prioritizing these metrics ensures the ship (business) is headed in the right direction, leading to increased sales and revenue.
- In contrast, fixating on metrics that don’t directly impact the business, such as the number of social media followers, is like relying on a malfunctioning compass that leads you astray.
Optimizing Resource Allocation
Optimizing resource allocation is akin to assigning roles on your ship. Just as every crew member has a specific role and responsibility, each resource in your analytics team should be allocated efficiently.
- Automation, in this context, is like assigning automated systems on your ship to handle routine tasks. These systems free up skilled analysts (crew members) to focus on high-value work, such as making strategic decisions.
- For example, imagine an automated system that continuously monitors website traffic and adjusts marketing campaigns based on real-time data. This automation ensures the ship’s crew can dedicate their time to making informed decisions rather than constantly tending to routine tasks.
Leveraging Automation and Machine Learning
Automation and machine learning are like advanced ship technology that enhances your voyage. They take on repetitive tasks, allowing experts to focus on high-value work, much like advanced navigation systems that automate certain ship functions.
- For instance, imagine a scenario where automated systems continuously monitor weather conditions and adjust the ship’s course to avoid storms or optimize fuel consumption. This frees up your skilled crew members (analysts) to focus on making strategic decisions, much like your ship’s captain concentrating on navigation strategies rather than routine tasks.
Navigating the Digital Analytics Journey
Challenges arise not from the abundance of data but from selecting the right metrics, optimizing resource allocation, and embracing automation. The Influence Matrix, a practical tool, guides you on this journey, ensuring you stay on course and achieve excellence in your Digital Analytics reports, much like a well-charted voyage that leads to a successful destination, with every detail of the journey considered and optimized for success.