
TLDR;
Retention is the ability to drive customers to continue buying/getting engaged.
Churn is the rate at which customers stop buying/getting engaged.
Less churn and more retention = scale
The tool used to analyze retention & churn: Cohort Analysis
Cohorts are user groups that share common characteristics over a certain period of time or event.
Cohort analysis allows you to discover friction points and cause so that corrective or preventive measures can be taken.
What is a cohort?
A cohort is a group of people who share a common characteristic or experience within a defined period.
In short, this tool helps us to analyze the buying or engagement pattern of a group of users. It helps us to understand if the efforts put are efficient enough over a period of time. Cohort analysis can be valuable as it helps to understand the evolution of products and users.
No, Cohort analysis is not the same as demographic analysis. Demographic analysis is based on the demographics of the population such as age, gender, location, etc., whereas cohort analysis is driven by the common stage of customer lifecycle e.g.: purchasing the product at the same time or vaccination of the same batch, etc.
First used in the world of medicine and research, cohort analysis observes patterns between different groups of people over time. By monitoring many cohorts, researchers can observe the effects of different procedures and treatments across many groups, and identify common patterns.
From an analysis perspective, we want to segment this group to observe their behavior over a longer period.
From an analyst POV, we try to understand if the same cohort behaves differently, what different cohorts are performing differently, and what is working and what is not?
The approach
You can’t improve what you don’t measure.
Cohort analysis involves the group of users, over the given period, and observing their behavior change. Each business will have its own unique set of reasons for its churn.
It’s a practice of organizing data by the initial purchase/engagement month and then looking out the stream of next interactions through the time based on the initial interaction month.
For instance, How do customers who signed up for Medium premium membership on Jan-22 differ from customers who signed up on Feb-22? Were there any discount campaigns in these two months? Do they behave differently over time?
Acquisition cohorts are a group of users based on an event when they were newly acquired as in purchase, signups, or downloads. Acquisition-based cohorts are mostly used during the launch of new campaigns, products, etc.
Behavioral cohorts are a group of users based on specific behaviors they exhibit, during a particular time period. These specific behaviors can be interactions with the product such as enabling notifications, updating communication preferences, updating bio, etc. You can test the typical behaviors of your most engaged users and find sticky parts of your product.
Acquisition cohort shows the retention and churn of users while behavioral cohorts determine the causes behind the retention and churn.
How do you measure?
By classifying people into the week/month/quarter they started using the service or engaged or opened an email, you can keep track of their engagement over time. You can now make assessments like “the Jan-22 cohort is engaged better than the February cohort” and the like. If your numbers are flat month over month, which is often the case even in the face of impressive growth, then you have not improved user engagement over that time.
Moreover, You can add a layer of demographics and campaigns among the cohorts. Customer segmentation with the ability to create cohorts and plot them on a timeline will be the gateway to many types of insights.
Cohort analysis will give businesses clear visibility over their efforts. There could be many applications such as:
- Channel scoring based on most valuable customers (not just one-time conversions)
- CLTV (Customer Lifetime Value) based on different segments
- Segment scoring basis on churn and retention
- For content sites, understand the key events such as newsletter signups, video watch time, clicks on call to action, frequency of repeat visitors, etc.
- Some advanced systems like content recommendation framework or retention & churn probability
How does this play out in practice?
Let’s assume that your team launches a new marketing campaign for a new product line in January with a series of discounts and offers. The team had put a lot of effort into optimizing full-funnel as you are getting customers every day. After two quarters, your total customers have gone up while the business folks are happy with the results. However, a closer look at each monthly cohort might show that the newer customers who bought in with said campaign have only purchased a few times compared to your previous customers.
This strategy could hurt in the long term as your non-loyal customers are growing. Moreover, you are segmenting the cohort by different demographics to understand where it is happening.
Such analysis will lead to critical retrospection of the campaign and rework of the strategy.
How to read the cohort table?
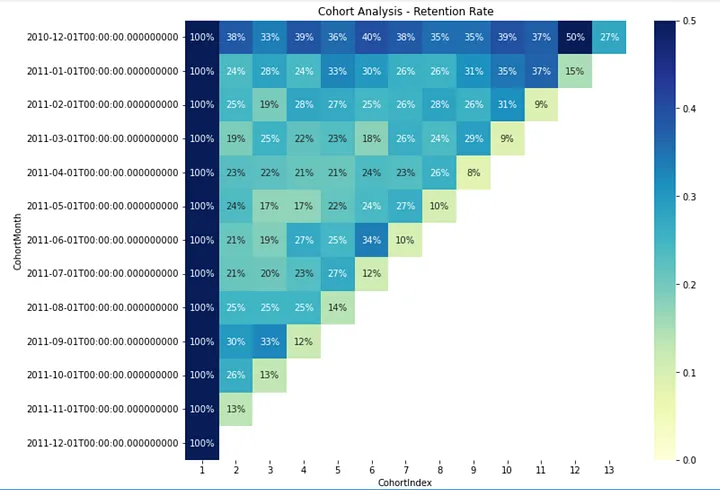
Above is the sample of simple cohort table generated in python. It shows the monthly customer retention rate derived from a shopping dataset.
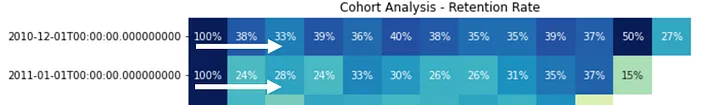
Horizontal axis: To follow each cohorts behavior horizontally
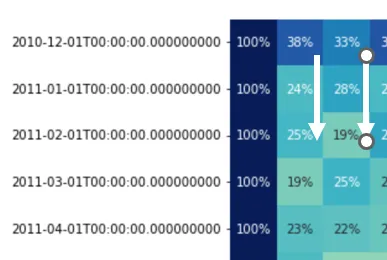
Vertical Axis: To compare value between cohorts
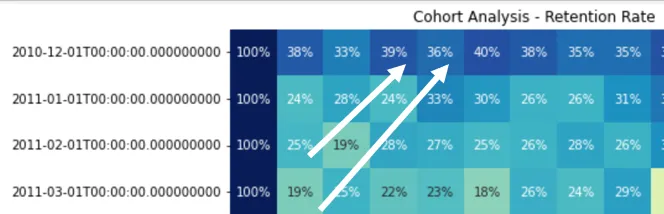
Diagonal Axis: To follow calendar months
The above chart can be visualize using different cohorts based on location, based on devices or OS, marketing channels. It helps to generate new business cases and customer insights beyond those shown in top-line metrics. Top-line metrics may help you look good but they could prove to be harmful to your business decisions. Businesses could deep dive into those use cases to track their variables across cohorts and segments.
In a world where marketing practices and campaign effectiveness are changing, keeping an eye on cohort analysis helps businesses to track their performance in real-time as they could prove to be incredibly useful.
Python Script to generate the above chart
## Importing libraries

import numpy as np

import pandas as pd

import datetime as dt

import seaborn as sns

import matplotlib.pyplot as plt

#For inline Chart Display

%matplotlib inline

#Read Dataset pro-tip: convert CSV to Excel

data = pd.read_excel('shopping.xlsx', sheet_name='shopping')

#check data

data.head()

#Clean data

cleaned_data = data.dropna(subset=['CustomerID'])

#Get Data using function

def get_month(x):

return dt.datetime(x.year, x.month, 1)

#Create new Invoice column and apply function

cleaned_data['InvoiceMonth'] = cleaned_data['InvoiceDate'].apply(get_month)

#Create CohortMonth column

cleaned_data['CohortMonth'] = cleaned_data.groupby('CustomerID')['InvoiceMonth'].transform('min')

#Extract dates to create cohort index. This will give the month lapsed number first and last transaction

#Function to extract date

def get_date(df, column):

year = df[column].dt.year

month = df[column].dt.month

day = df[column].dt.day

return year, month, day

invoice_year, invoice_month, _ = get_date(cleaned_data, 'InvoiceMonth')

cohort_year, cohort_month, _ = get_date(cleaned_data, 'CohortMonth')

#Difference between Cohort and invoice dates. It will help to calculate the cohort index

year_diff = invoice_year - cohort_year

month_diff = invoice_month - cohort_month

#Now creating a column that has the calclation shows the

cleaned_data['CohortIndex'] = year_diff * 12 + month_diff + 1

#Check Data

cleaned_data.head()

#Group by and pivot table functions to create cohort table

cohort_data = cleaned_data.groupby(['CohortMonth', 'CohortIndex'])['CustomerID'].apply(pd.Series.nunique).reset_index()

cohort_count = cohort_data.pivot_table(index = 'CohortMonth', columns = 'CohortIndex',values = 'CustomerID')

#Calculate Retention Percentage

cohort_size = cohort_count.iloc[:,0] #select all the rows : select the first column '0'

retention = cohort_count.divide(cohort_size, axis=0) #Divide the cohort by the first column

retention.round(3) # round the retention to 3 places

#Cohort Heatmap

plt.figure(figsize = (11,9)) #Increase size

plt.title('Cohort Analysis - Retention Rate') #Add titles to chart

sns.heatmap(data = retention, #data source

annot = True, #Set annotation true

fmt = '.0%', # Shows in percentage format

vmin = 0.0, #Values to anchor the colormap

vmax = 0.5, #Values to anchor the colormap

cmap = "YlGnBu") #Color scheme. Try coolwarm

plt.show()

#You can also try creating pivot of sales, orders, etc.